
RELATED POSTS
RELATED PRODUCTS
MORE INFO
Event Logger Activation
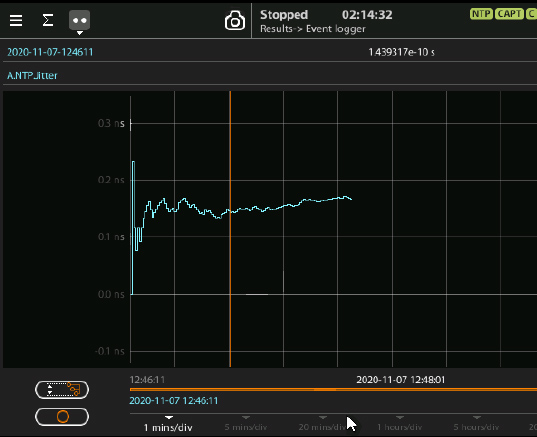
Counts, statistics, LEDs provide info about the events and how they were recorded, but they do not say much about how they are distributed in time. This information provides the logger with a representation to track the evolution of key parameters.
BARCELONA NOV.23.2023
The Event Logger
Global counts, statistics and LEDs provide information about which events and how many of them have been registered, but they do not say much about how they are distributed in time. This information is provided by the xGenius / Zeus graphical display tool or the event logger.
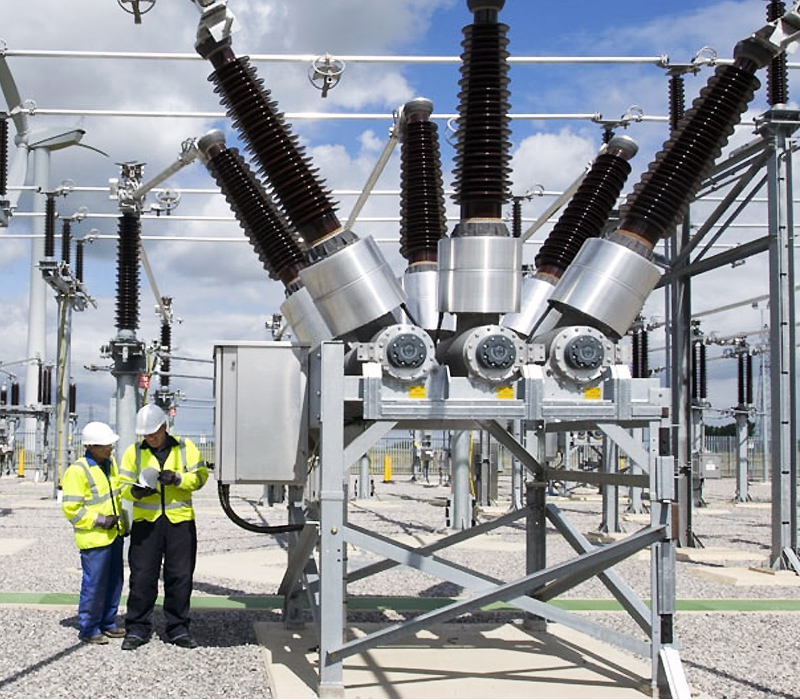
Fig 1. Verify the installation with the Zeus tester.
The Event Logger feature allows you to select one or more events and track them, recording all changes along with the time and date these changes were registered with 1-second resolution. The event logger provides different views and zoom levels to analyze events on different time scales.
Configuring the Event Logger
Traceable events are categorized into different classes. In addition, each test port has its own traceable events. These events can be different for each test port.
- Anomalies/Defects
Bandwidth statistics
Frame layer statistics
SLA statistics
BERT
PTP
Synchronization
Reference Events
Once event logging has been enabled and the monitored events have been selected, the device will begin to generate a trace file for each test started with Run (or automatically using the Autostart/Stop functionality).
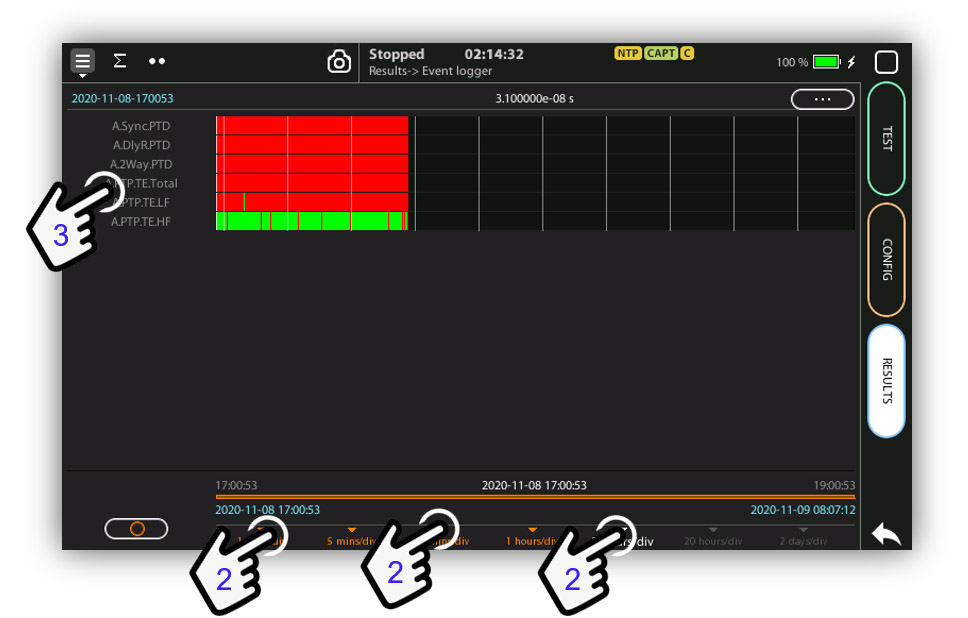
Fig 2. The xGenius / Zeus event logger logs all events selected by the filter.
Viewing Logs
You can view trace files from either completed tests or the current test. You don’t have to wait until the end of the test to view a trace file.
Exporting logs
Users can export log files in CSV format. These files can be used as input for data processing software packages. A typical application is to use these graphics to generate high resolution plots from the data measured by xGenius / Zeus. To export a file, you can use the regular file export procedure for log files. You can also export log files using a web browser. Once the trace files have been exported to the external device, they can be viewed, renamed or deleted from the file manager just like any other output file generated by the test device. You can also copy and edit the log file on an external computer. Basically, a log file is a large table where each column is .
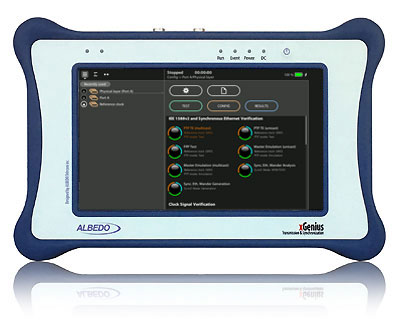
Fig 3. Tester designed to turn-up Ethernet networks.
xGenius & Zeus
xGenius and Zeus provide in-depth insight into the design, installation, maintenance, troubleshooting and engineering of Smart Grid communications infrastructures. The instrument can test Ethernet/IP, PTP, GbE, IRIG-B, T1/E1, G703, C37.94 and GOOSE, SV and MMS protocols. One-way delay testing, supported by GPS, is available on all interfaces. Zeus has a set of programmable filters to capture live traffic at wire speed. You can now analyze GOOSE, SV, MMS and other protocols to decode and store them in PCAP format or calculate propagation delay from local or remote substations.
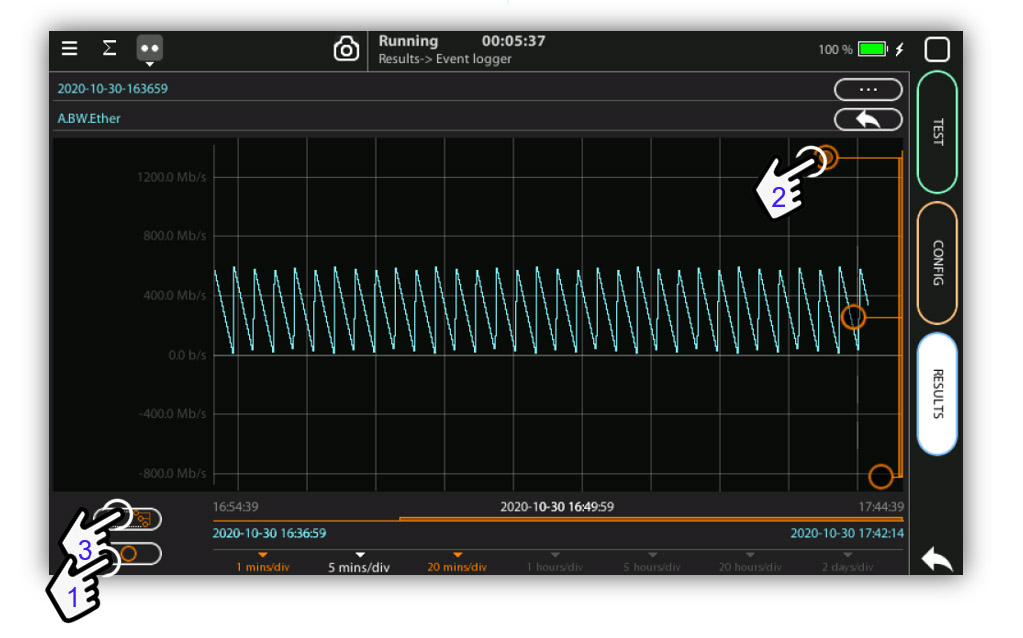
Fig 4. Chronogram showing test results and evolution.